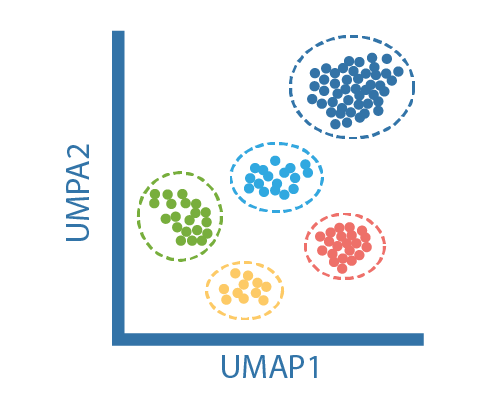
Transcriptional analysis at the single-cell level has become the technology of choice to assess cellular heterogeneity in tissues and for elucidating the interplay dynamics between cellular populations. At the technical level, there are two main paradigm in scRNA-seq which in turn influence the analysis step. The most common approach is to use microscopic droplets or wells to isolate a large number of cells and then sequence the libraries relatively shallow. This high-througput, low-depth strategy (typical 10x chromium platform) has the advantage to support unique molecular identifiers (UMIs). UMIs are short barcodes that are attached to transcripts before amplification, allowing the removal of PCR duplicates and obtain a more accurate estimate of expression levels. The major shortcoming is that it only allows for the 5′ or 3′ end of each mRNA to be sequences. The other scRNA-seq paradigm takes an low-throughput, high-depth approach, isolating cells into individual wells and apply the Smart-seq2 protocol. This method show higher sensitivity than droplet based technologies and allow for the entire transcript to be profiled.
We will first start by demultiplexing reads belonging to the same cell followed by a quality control step where low quality reads, adapters and primers will be removed from reads.
After the initial processing and QC, alignment to the genome or transcriptome is performed in order to detect and quantify the transcripts in each cell. After alignment, expression levels need will be quantified by counting the reads aligned to each gene.
Following the alignment and quantification step, several filtering steps are necessary to remove low-quality data or outliers. Per-sample metrics such as the number of reads mapped to each cell, the number of genes or trancripts detected and the percentage of reads mapping to mitochondrial gens (increased mitochondrial RNA content is usually associated with dead cells) or spike-ins are useful to measure sample quality. Data originating from doublets or aggregates of more cells will be discarded.