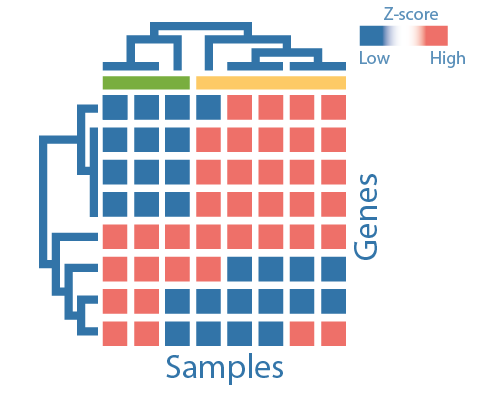
A common method of visualising gene expression data is to display it as a heatmap which can be particularly usefull to identify commnonly regulated genes or biological signatures associated with a particular condition. Heatmaps can be combined with clustering methods which group genes and/or samples based on similar gene expression patterns. Alterations in gene expression are displayed by alterations of colour and/or intensity.